

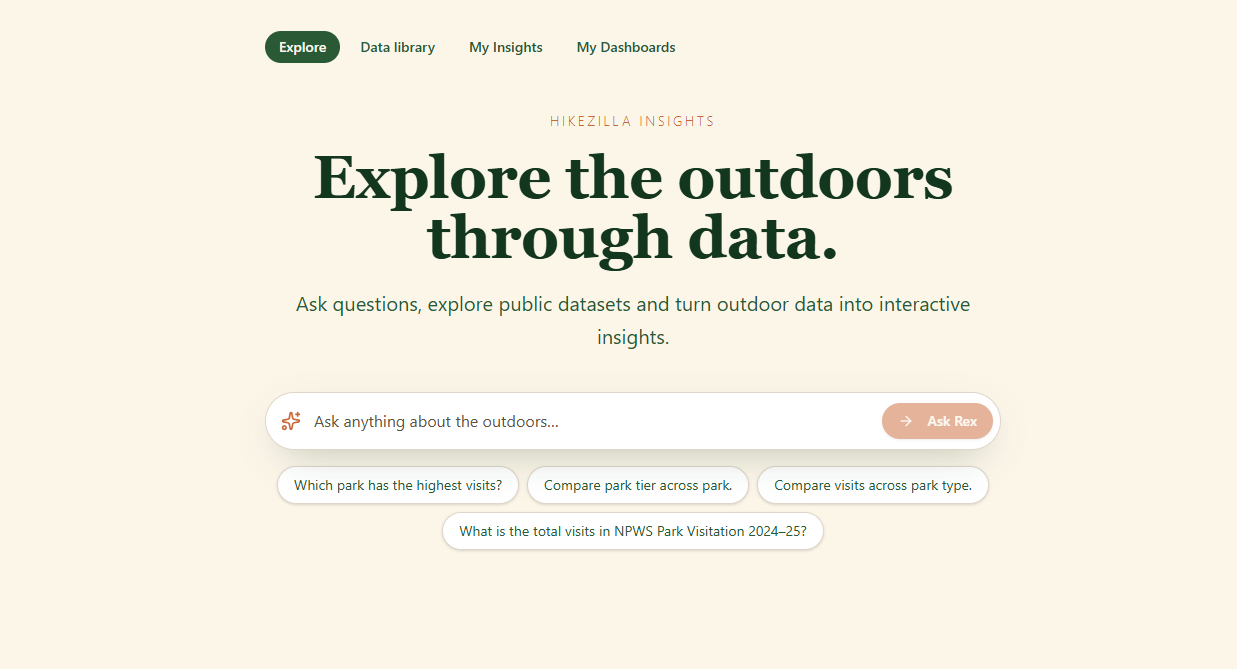
Hikezilla Insights
Turn fragmented outdoor data into stories, maps and insights that help us better understand the places we explore.
About
There’s an incredible amount of outdoor data already out there — parks, trails, weather, wildlife, rescues, fires, tourism and more. The problem is that it’s scattered across different places and often difficult to make sense of.
Hikezilla Insights brings that data together and makes it useful, interesting and fun to explore. People can connect datasets, build dashboards and create interactive stories about the outdoors — without needing to be a data scientist.
It’s also another way to contribute to Hikezilla. Whether you’re into data, GIS, research, visualisation or simply curious, you can help uncover and share new stories about the outdoors.
What's done
- Initial Hikezilla Insights platform built
- Dataset library and individual dataset pages
- Basic data exploration and visualisation
- Users can create and save insights from datasets
- Saved insights can be added to dashboards
- Started collecting Australian outdoor, environmental and government datasets
Next steps
- Allow insights to combine multiple datasets
- Build better interactive and map-based visualisations
- Create a more flexible dashboard builder
- Add story-style dashboards with text, maps, charts and timelines
- Connect datasets geographically through parks, regions and boundaries
- Build “Blue Mountains Through the Years” as the first showcase
- Make it easier for non-technical users to explore data with Rex
- Eventually allow community-created dashboards and data challenges
- Launch the Hikezilla Open Data API — give developers, researchers and community projects access to Hikezilla's growing collection of connected outdoor datasets.
Wins
No approved contributions yet.